How to Read Your Google Analytics Dashboard

 Google Analytics showcases the power of digital marketing in a variety of ways. At your fingertips, you have data about your website visitors that you can use to target and improve your marketing efforts.
In other words, the platform can be the guiding force behind the entirety of your marketing efforts.
Unfortunately, many small businesses don’t get to reap the rewards of Google Analytics.
That’s because, as powerful as the platform can be, it also has the potential for immense confusion. Log in for the first time, and the amount of metrics and charts staring at you may prompt you to log back out.
To get over that hump, and begin to take advantage of its power, here are 20 terms, tips, and tools that allow even marketing novices to make the most out of their Google Analytics account.
BLOG: How to Read Your #GoogleAnalytics Dashboard | 20 Terms, Tips and Tools Click To Tweet
10 Essential Terms of Google Analytics
First, let’s start with a quick vocabulary lessons. The below definitions help you make sense of the variety of metrics that Google Analytics can track and report on its default dashboards and in custom reports.
1) Sessions vs. Users
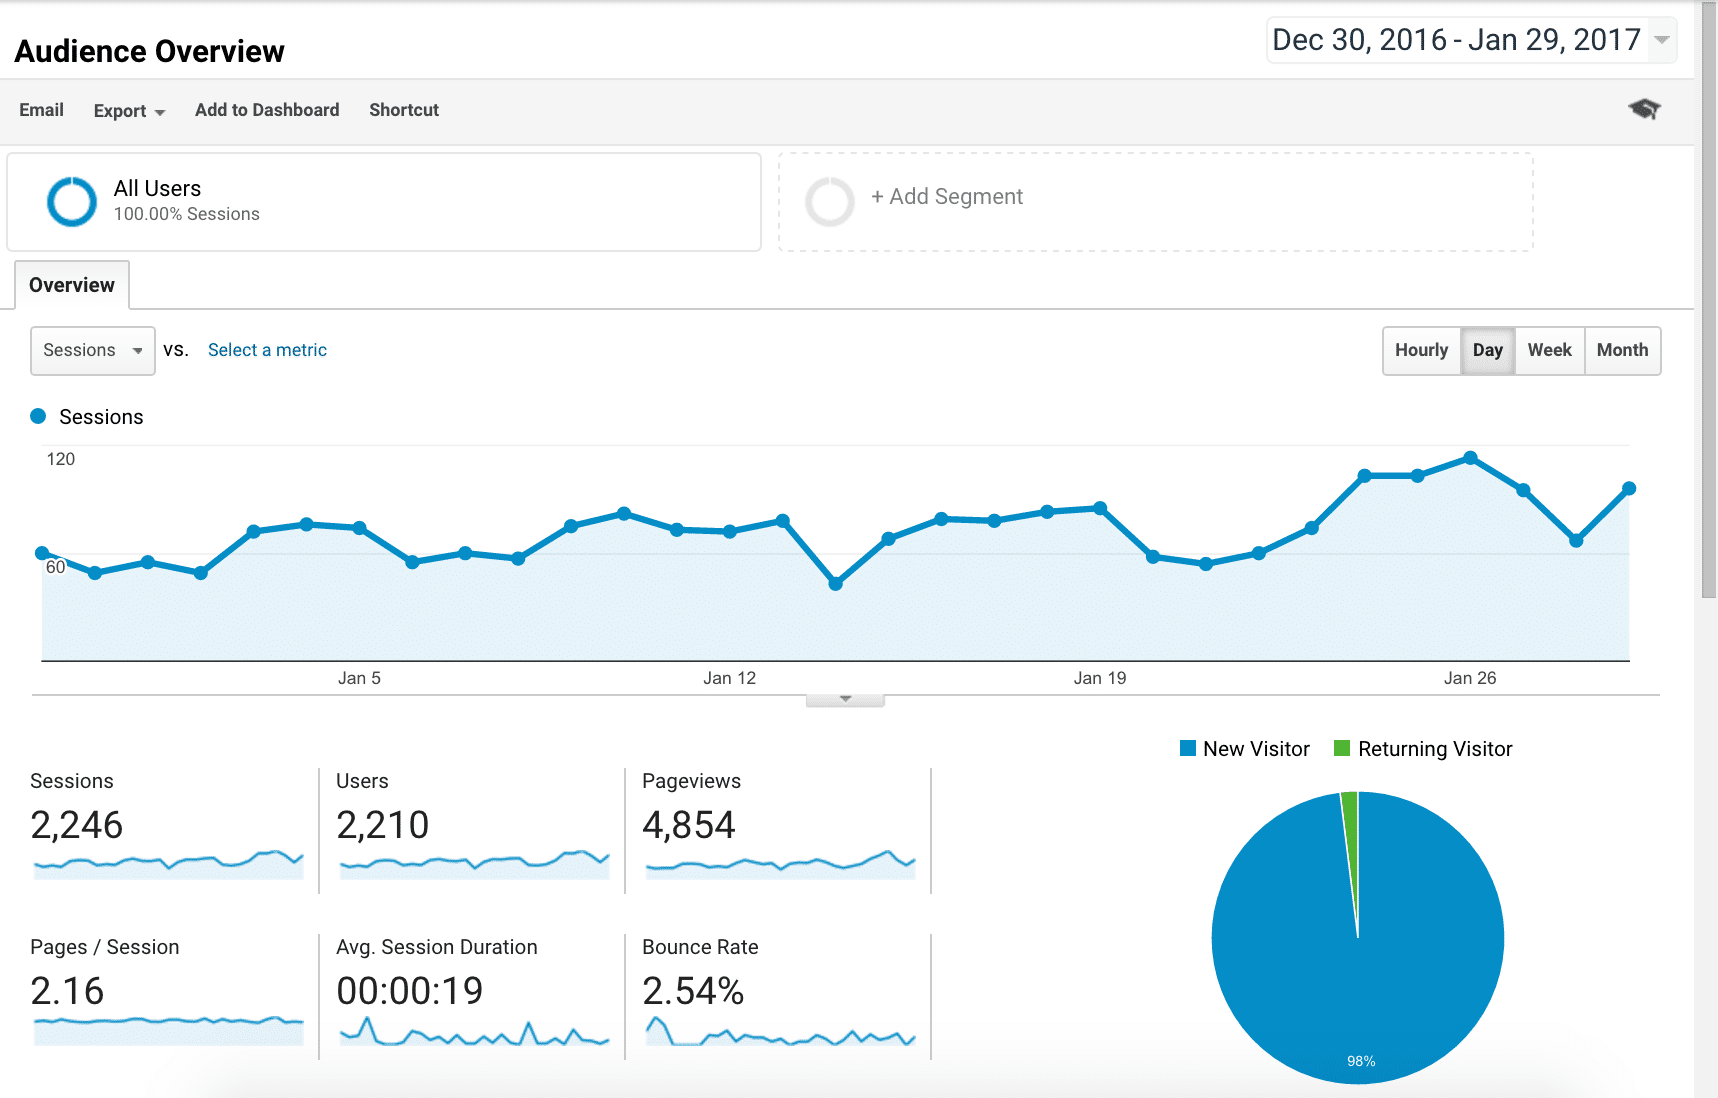
The core metrics in many of your reports, and even your introductory dashboard, will be sessions and users. Sessions simply describe how many times someone had an experience on your website, meaning they entered at some point and left at another. Users, on the other hand, describe the amount of people that had those experiences.
2) Page Views and Unique Page Views
Total page views are somewhat self-explanatory. They differ from unique page views in that they count someone twice if they visit the same page twice. However, the same action only counts as one unique page view.
3) New vs. Returning Visitors
How many of your website visitors arrive for the first time, or return from a past visit? This metric gives you a better idea of the answer, helping you determine how you should structure your content depending on your audience’s existing level of familiarity.
4) Bounce and Exit Rate
Bounce rate counts the percentage of users who leave your website after only seeing a single page. For example, they may come to your home page, and leave without ever navigating deeper into your website. Exit rate, on the other hand, on the other hand, counts the users who leave from a certain page, even if they’ve visited other pages in the process.
5) Average Time on Site
How long your visitors stay on your website on average is an important metric to track. The more pages they visit, the longer they stay, and the higher their chances of converting into leads and customers become.
6) Traffic Sources
In a variety of reports, you may come across this KPI. It describes where exactly your traffic comes from, either defined by you through a UTM code or based on knowledge Google can easily gather.
7) Search Engine, Direct, and Referral Traffic
The three most common traffic sources will fall into one of these three categories. Search engine traffic can be broken down into paid (through AdWords) and organic (unpaid). Direct traffic involves users directly typing your website URL into their browser, while referral traffic counts visit from users who clicked on a link on another website.
8) Source, Medium, and Campaigns
Google Analytics allows you to track manually coded URLs to better evaluate your marketing efforts through its URL builder. You can pull in each of these parameters into various reports, allowing you to track entire campaigns or individual tactics within these campaigns.
9) Goals and Conversions
Google defines conversions more broadly than its competitors. You can set up goals that range from a minimum time spent on your website, a lead conversion, a specific sequence of pages visited, and more. Then, you can evaluate your various traffic sources, demographics, and more based on these goal conversions.
10) Goal Value
If you know how much revenue a goal conversion typically brings, you can set up a value for each conversion. For example, you may find that the average customer generates $100 in revenue, and 20 percent of your leads convert to customers. In that case, a goal conversion would be worth $20.
5 Tips to Set Up Your Google Analytics Dashboards
With the above terms in mind, it’s time to take a closer look at the set up of your dashboard. Here are 5 tips that can help you maximize the efficiency of the data provided through the platform.
1) Decide on Whether You Need Custom
Google’s standard dashboard focuses on a broad range of metrics that will be sufficient for many small businesses. However, you can also go custom. Follow tutorials like this to build a custom dashboard that reports exactly what you’re looking for.
2) Focus on Your Marketing Goals
If you do decide to build out a custom dashboard, make sure you eliminate all extraneous information. Instead, take the opportunity to build out a platform specifically designed to help you accomplish your marketing and business growth goals.
3) Understand and Leverage Existing Reports
Google Analytics allows you to report on website and visitor data based on your audience, traffic and conversions, and user behavior while on your site. The right dashboard offers a mix of two, helping you understand visitor demographics along with a better understanding on how those users act while visiting your website, and whether they’re reaching your marketing goals.
4) Set Up a Variety of Conversions
Customizing your dashboard only makes sense if you know exactly what you want. Once you do, you can build a platform for yourself that includes a number of conversion goals specifically designed for your needs, from lead conversions to eCommerce transactions.
5) Adjust as Needed
Finally, don’t treat your dashboard as a one-off project. Instead, take every opportunity you can to build and improve its features. If you find yourself not using any of the reports you’ve built, eliminate it in favor of a more relevant metric.
5 Tools to Maximize Your Google Analytics Knowledge
Finally, even setting up your dashboard to more closely resemble your business needs and goals is only the beginning. With the below 5 tools, you can begin to get a deeper understanding of Google Analytics, setting up advanced goals and conversion metrics to get the data you need to more effectively market your business.
- The Absolute Beginner’s Guide to Google Analytics (Moz)
- Google Analytics for Beginners (Google video course)
- Google Analytics Guide (set of slides by Google)
- How to Set a Goal in Google Analytics to Track Conversions (Monster Insights)
- Create and Customize Dashboards (Google Support)
Google Analytics is so ubiquitous that the internet is full of helpful tutorials on the subjects. Using the above five options, you can begin to learn more – but don’t hesitate to browse the web for help on an individual topics within the platform, as well.
We’ve still only scratched the surface of everything that Google Analytics is and can be for your business. The platform’s immense complexity allows for a wide range of advanced reporting and capabilities that are too much for a single blog post.
That’s why we invite you to browse our online courses for Google Analytics guides. Of course, you can also engage our help in your digital marketing efforts directly, outsourcing some of your analytics practices for increased success in reaching your audience and growing your business.
Contact us to learn more about our services, and begin to take advantage one everything the platform has to offer.